Product ownership · Monetization
Out of 100+ A/B tests across 20+ subscription apps, two that show how I work on the moment people decide to pay: how the paywall shows the product, and how it charges for it.
Overview
The paywall is where a free user decides whether the product is worth paying for. These experiments asked what makes that decision easier: seeing the value more clearly, or having more ways to pay for it.
Experiment 1 · Presentation
A new paywall structure that shows what the app does for your voice.
Experiment 2 · Plans
Monthly and yearly plans added next to the only plan it had: weekly.
Experiment 1 · Presentation
A karaoke app for singing along to backing tracks with autotune, sold on weekly, monthly and yearly plans. Its long paywall led with an illustration of headphones and listed everything at once.
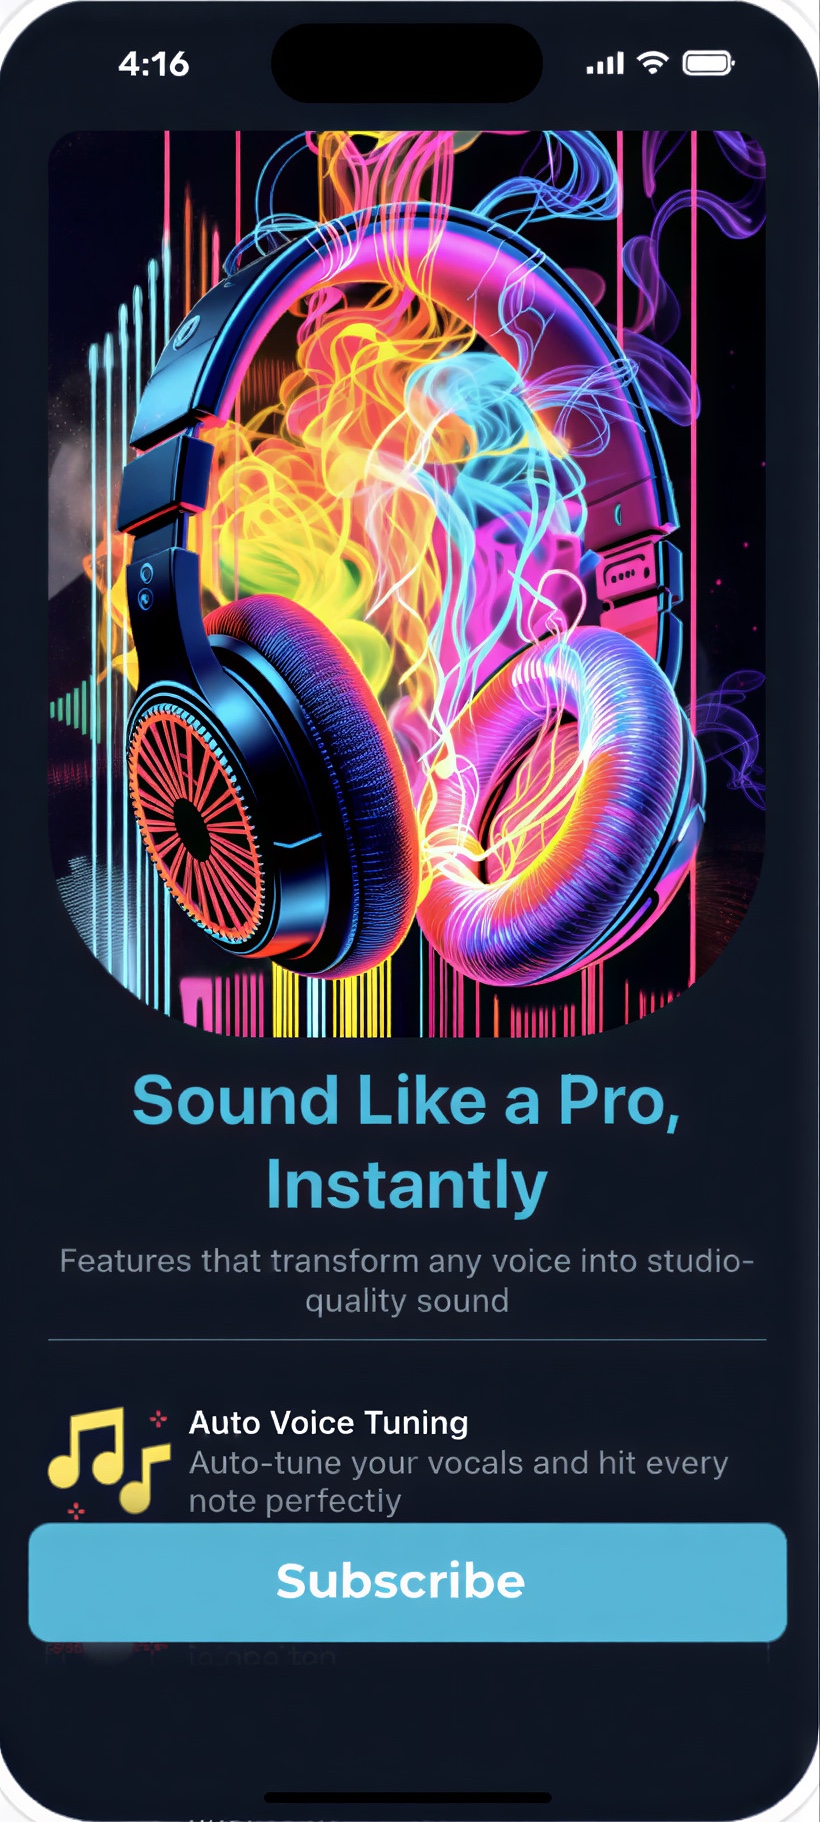
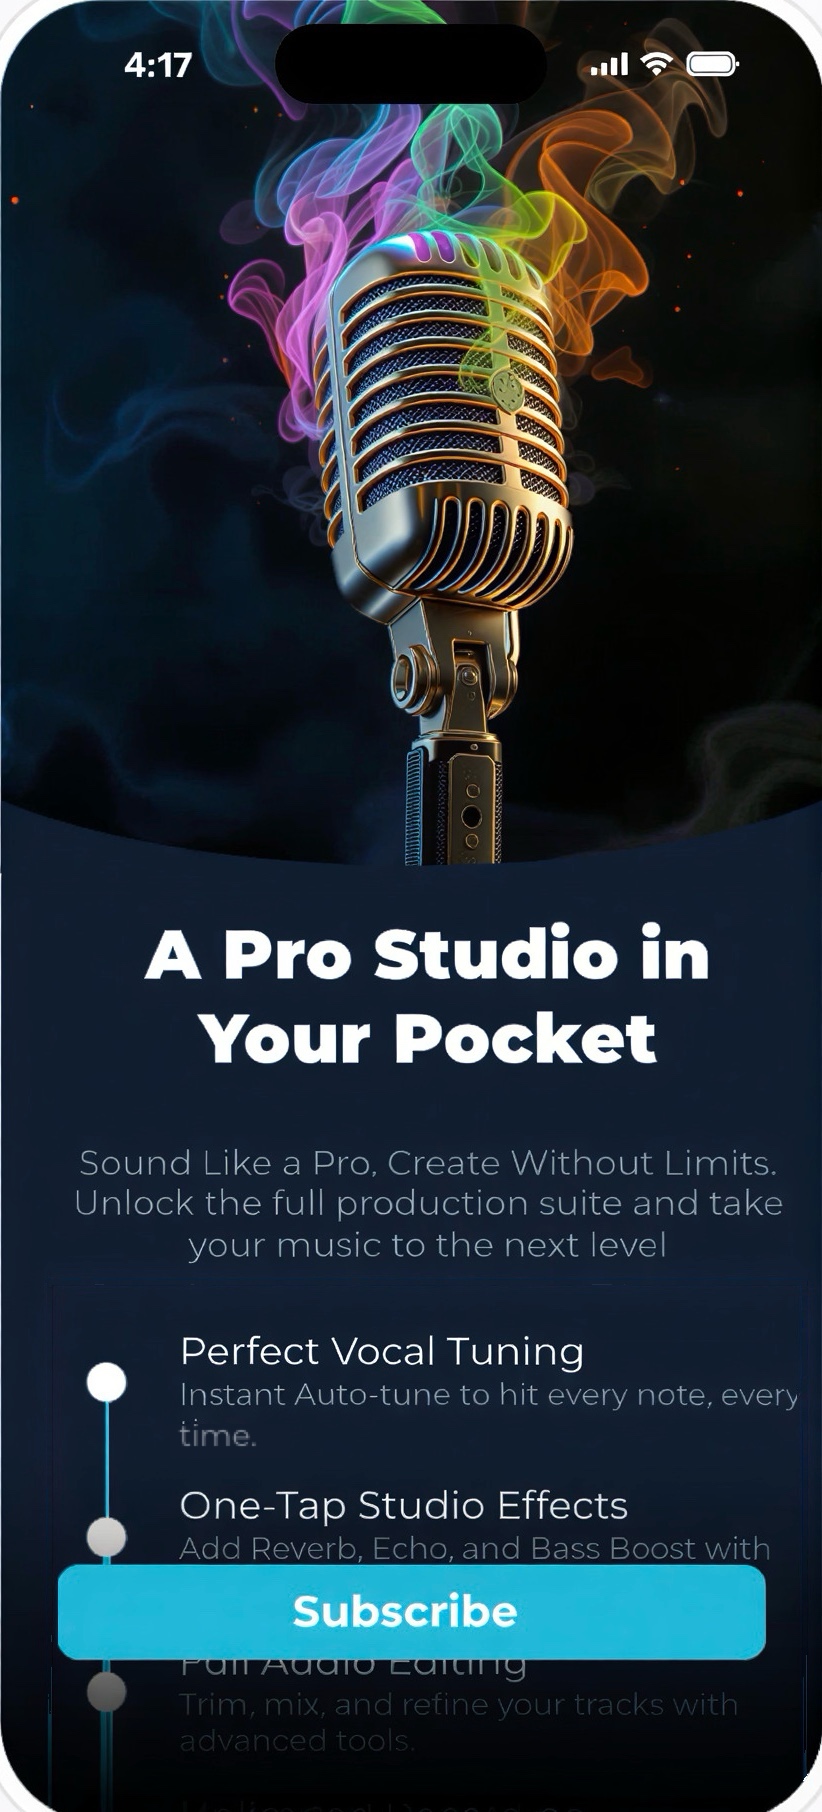
If users see a high-quality paywall that shows what the product does, more of them will decide to pay, because a clear reason makes the decision easier.
The image moved from listening to singing: a studio microphone instead of headphones. Each feature was rewritten around what it does for your voice, in a guided order, then social proof and the plans. Same plans and prices.
All users, 14 days, 50/50. Primary metric: trial conversion. Guardrails: purchase conversion and revenue.
revenue per 1,000 users.
purchase conversion.
trial conversion, 10.5% against 10.4%.
probability that the variant is the better one.
Reading the result
Trials didn't move; buyers did. The results were read months after the test, with renewals and refunds already in. 67% is a lean, not proof, but every metric pointed the same way and none got worse over time, so the variant became the default.
What came next
The US moved to its own track: markets read a paywall differently, so the paywall was tested again there on its own, followed by small step-by-step price increases on every plan.
Experiment 2 · Plans
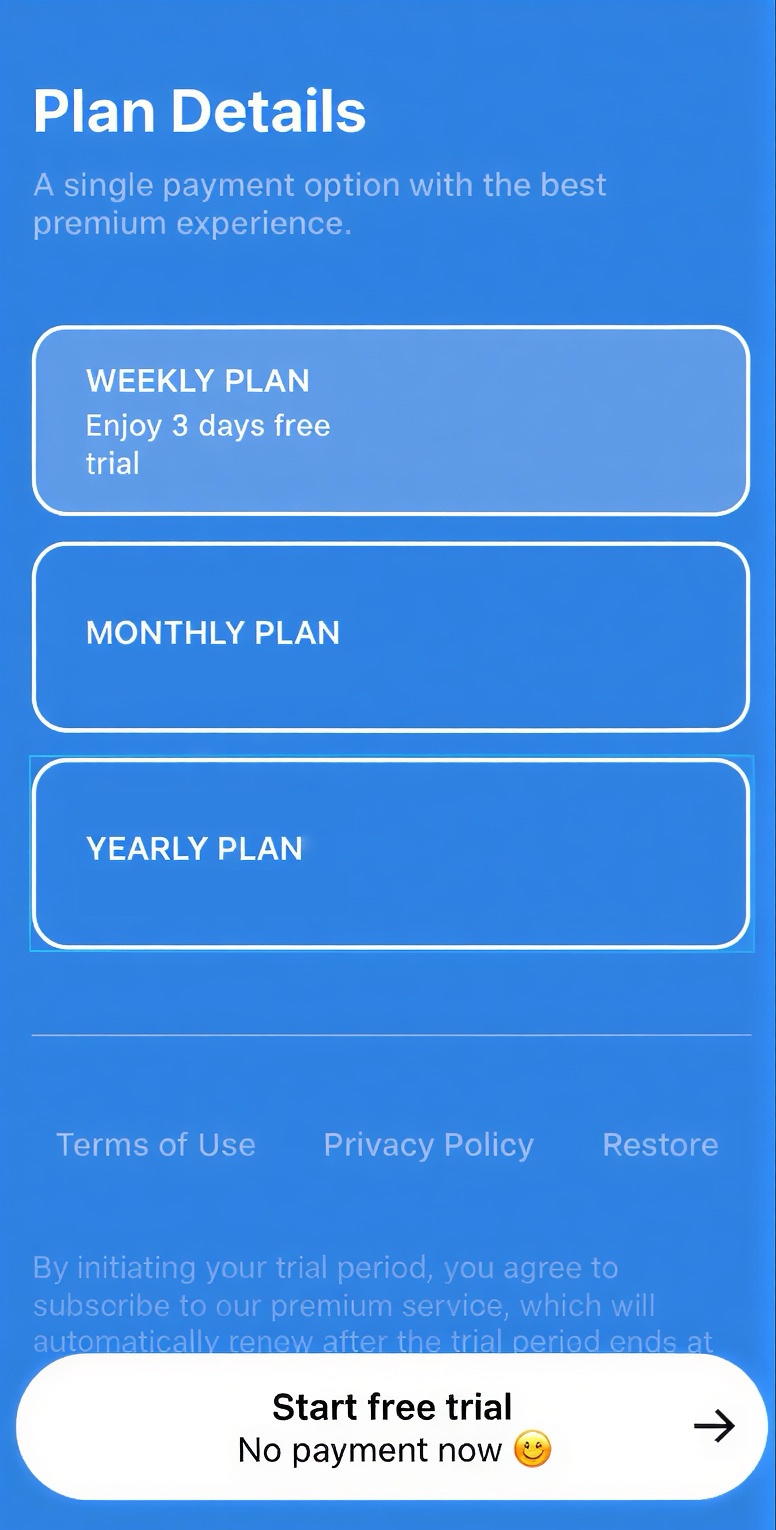
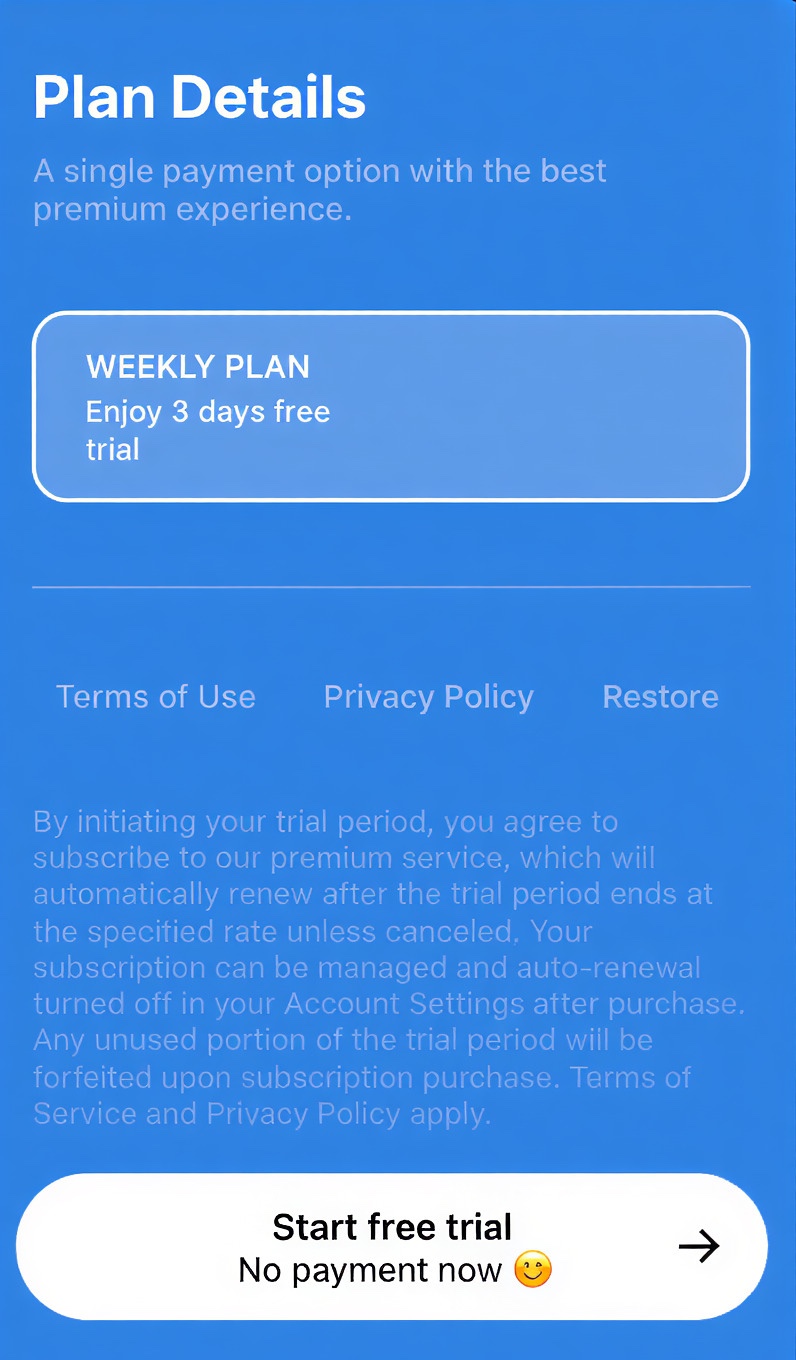
A phone cleaning app for clearing files off your phone. Because of what it does, it only offered one plan: weekly, with a three-day free trial.


With more plans, people would either pick a more flexible option or go straight to the recommended one. Either way, more of them would buy.
Only the plans. Monthly and yearly were added next to the weekly one, which kept the only free trial, and the paywall design stayed exactly the same. Changing both at once would have made it impossible to tell which one caused the result.
All users, 6 days, 50/50. Primary metric: revenue per user. Guardrails: purchase conversion and refund rate.
revenue per 1,000 users.
purchase conversion.
refund rate: 2% against 18% in the control.
probability that the variant is the better one.
Reading the result
Every purchase in the test was still weekly. The monthly and yearly plans worked as anchors: next to them, the weekly plan looked like the easy choice. The results were read months after the test, with renewals and refunds already in, so the guardrails are part of the result, not a follow-up.
What came next
The new plans shipped. Then the same structure was tested across the other apps in the portfolio, to learn where it works and where it doesn't.
Learn
How a paywall shows the product changes how quickly people decide to buy, even with the same plans and prices.
More plans changed how people bought, even though every buyer still chose weekly. Choice is psychological, not just practical.
Experiment 1 won on purchases, not trials. Guardrails are where the real result often shows up.